Passing your driving test is a significant milestone, symbolising independence, freedom, and opportunity. However, driving test pass rates in the UK vary significantly based on factors such as location, gender, season, and even time of day. Understanding these trends can help learners plan smarter and boost their chances of success.
In this guide, we'll break down the latest UK driving test statistics, drawing insights from official DVSA data. We'll cover key trends over the years, gender disparities, regional differences, and actionable strategies to help learners, instructors, and policymakers navigate the UK driving test landscape more effectively.
🚦 Understanding the Latest UK Driving Test Statistics
The Driver and Vehicle Standards Agency (DVSA) regularly releases comprehensive data about driving test performance across the UK. This data offers valuable insights into pass rates, regional performance, gender differences, and pandemic-related impacts.
📊 Key Figures from Recent Driving Test Data
- National Average Pass Rate: Around 48.5%.
- Peak Year for Tests Conducted: 2023/24, with 1,945,225 tests.
- Lowest Year for Tests Conducted: 2020/21 (pandemic year) with just 436,044 tests.
- Best Pass Rate (Overall): 2020/21 – 49.8%, despite fewer tests being conducted.
- Manual vs Automatic: Automatic cars are seeing increasing popularity, with pass rates slightly higher on average.
🧐 Why These Statistics Matter
- Learners can better strategise when and where to book their tests.
- Instructors can focus on areas where students tend to struggle.
- Policymakers can address regional disparities and resource shortages.
Understanding these trends isn't just data—it’s an actionable guide to smarter preparation.
📈 Trends Over the Years: Key Observations (2007/08 – 2024/25 YTD)
Driving test trends have seen notable changes over the years, influenced by evolving driving habits, pandemic disruptions, and shifting demographics.
🧑🤝🧑 Male vs Female Driving Test Pass Rates
- Males: Historically have a higher pass rate, peaking at 52.5% in 2020/21.
- Females: Peaked at 47.1% in 2020/21 but have shown gradual improvement since 2007/08 when the pass rate was just 41.3%.
- Overall Trend: The gender gap is narrowing slightly over time, but male learners continue to outperform female learners statistically.
📅 Impact of the Pandemic (2020/21)
- Significant Drop in Tests Conducted: Only 436,044 tests across both genders.
- Higher Pass Rates: With fewer candidates tested, the pass rate spiked to 49.8%.
- Reasoning: Fewer tests may have allowed instructors to focus more intensively on individual learners, improving preparedness.
📊 General Trends:
- Pass rates have seen gradual improvement from 44.2% in 2007/08 to 48.5% in recent years.
- Test demand surged post-pandemic, with 2023/24 marking the highest number of tests conducted.
- Improved online learning resources have played a key role in better preparation levels among learners.
🗺️ Regional Differences and Trends
Driving test pass rates vary significantly based on whether a test centre is in an urban or rural area.
🏙️ Urban vs Rural Test Centres
- Urban Centres: Generally lower pass rates due to congested roads, complex junctions, and higher stress environments. Pass rates often range between 35%–40%.
- Rural Centres: Simpler road layouts and lower traffic density contribute to higher pass rates, often exceeding 60%.
📍 Test Centre Variability
Even within the same city or region, pass rates can vary:
- Centres on city outskirts often perform better than those in the city centre.
- Local factors such as road design, test route complexity, and infrastructure changes significantly influence pass rates.
📊 Year-on-Year Variability
Pass rates can fluctuate yearly depending on:
- Changes to test routes.
- Local infrastructure improvements or disruptions.
- Seasonal weather patterns impacting road conditions.
📝 Key Takeaway:
If you're flexible about where to take your test, choosing a centre in a suburban or rural area with a historically high pass rate could improve your chances.
🏆 Top 10 Test Centres with the Highest Pass Rates
| Rank | Test Centre | Location | Pass Rate (%) |
|---|---|---|---|
| 1 | Newtown | Wales | 72.5 |
| 2 | Montrose | Scotland | 71.4 |
| 3 | Forfar | Scotland | 70.2 |
| 4 | Arbroath | Scotland | 70.1 |
| 5 | Kendal | England | 69.5 |
| 6 | Galashiels | Scotland | 69.1 |
| 7 | Dorchester | England | 67.4 |
| 8 | Alness | Scotland | 66.0 |
| 9 | Fraserburgh | Scotland | 65.5 |
| 10 | Gairloch | Scotland | 65.0 |
These centres are generally located in quieter areas, with simpler traffic conditions, which helps learners perform better under test conditions.
📉 Top 10 Test Centres with the Lowest Pass Rates
| Rank | Test Centre | Location | Pass Rate (%) |
|---|---|---|---|
| 1 | Wolverhampton | England | 37.2 |
| 2 | Featherstone | England | 37.5 |
| 3 | Chingford | London | 38.0 |
| 4 | Speke | Liverpool | 39.1 |
| 5 | Luton | England | 40.0 |
| 6 | Wednesbury | England | 40.0 |
| 7 | Norris Green | Liverpool | 40.9 |
| 8 | Crawley | England | 41.0 |
| 9 | Leicester | England | 41.1 |
| 10 | Greenford | London | 41.1 |
These centres are typically located in busy urban areas, where factors such as traffic congestion and complex road layouts create challenging conditions for learners.
🕒 Best Time of Day to Take Your Driving Test
The time of day you book your driving test can have a significant impact on your performance. Understanding traffic patterns and choosing the optimal time slot can reduce stress and improve your focus.
🌟 Best Time Slots:
- Mid-Morning (10:00 AM – 11:30 AM): Traffic tends to be calmer after the morning rush hour, and roads are generally clearer.
- Early Afternoon (1:00 PM – 3:00 PM): Another relatively calm period, with less traffic congestion.
🚦 Worst Time Slots:
- Morning Rush Hour (8:00 AM – 9:30 AM): Heavy traffic and impatient drivers can make this time particularly stressful.
- Evening Rush Hour (4:00 PM – 5:30 PM): Traffic congestion and tiredness at the end of the day can hinder focus and calmness.
📌 Key Takeaway:
Booking your test during mid-morning or early afternoon slots can increase your chances of performing well and feeling less pressured.
🌦️ Best Season for Taking Your Driving Test
Weather and seasonal factors can also influence your driving test experience. Here's how each season compares:
🌸 Spring (March – May):
- Clear weather with mild temperatures.
- Longer daylight hours.
- Minimal road hazards like ice or fallen leaves.
☀️ Summer (June – August):
- Generally the most pleasant weather for driving.
- Clear visibility and dry roads.
- However, increased traffic from summer holidays can be a factor.
🍂 Autumn (September – November):
- Similar benefits to spring.
- Watch out for wet leaves and slippery roads.
❄️ Winter (December – February):
- Short daylight hours.
- Risk of icy or snowy roads.
- Higher stress levels due to unpredictable weather conditions.
📌 Key Takeaway:
If possible, aim to take your test in spring or early autumn for the most favorable driving conditions.
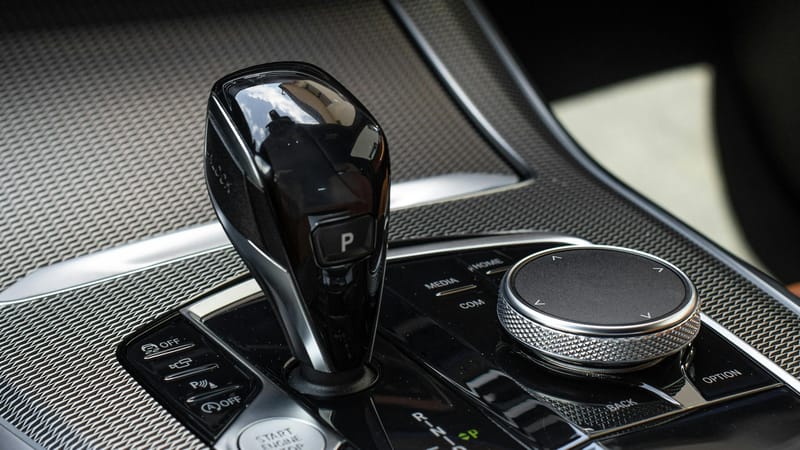
🚘 Manual vs Automatic Driving Test Pass Rates
The type of car you learn in can affect your chances of passing the driving test.
📊 Key Observations:
- Automatic Pass Rates: Slightly higher than manual, especially among learners who struggle with clutch control.
- Manual Pass Rates: While more challenging, a manual licence allows you to drive both manual and automatic cars.
🤔 Which One Should You Choose?
- Manual: Better if you plan to drive manual cars in the future or want more flexibility.
- Automatic: Ideal for urban driving and learners who find clutch control challenging.
Quick Fact: Electric vehicles (EVs) are exclusively automatic, aligning with the UK’s 2030 petrol and diesel car ban.
👤 First-Time vs Repeat Test Takers
Statistically, first-time test takers have slightly lower pass rates than repeat candidates.
📝 First-Time Pass Rates:
- Lower due to nervousness and unfamiliarity with test conditions.
- Learners often underestimate the importance of mock tests.
🔄 Repeat Test Takers:
- More familiar with the test process.
- Typically more confident, but some may carry over bad habits from previous tests.
📌 Key Takeaway:
Whether you're taking the test for the first time or retaking it, preparation and consistent practice are the most important factors.
👥 Demographic Insights: Gender and Age Trends
🧑🤝🧑 Gender Differences in Pass Rates:
- Males: Historically higher pass rates, peaking at 52.5% in 2020/21.
- Females: Improved from 41.3% in 2007/08 to around 47.1% in recent years.
📊 Age Trends:
- Younger learners (17–20 years) often have higher pass rates due to better learning retention.
- Older learners may face more anxiety but benefit from life experience and cautious driving habits.
📌 Key Takeaway:
While trends show statistical differences, your preparation, mindset, and practice determine success more than age or gender.
🦠 Pandemic Impact on Driving Tests
The pandemic significantly disrupted driving tests, but it also brought some interesting trends:
- Drop in Test Availability: During lockdowns, test centres operated at reduced capacity.
- Spike in Pass Rates: Pass rates increased due to fewer candidates and more focused preparation.
- Backlog: A surge in demand post-pandemic caused long waiting times for driving test slots.
📌 Key Takeaway:
The pandemic highlighted the importance of preparation and adaptability. Learners who maximised their practice time often performed better.
🎓 Top Tips to Improve Your Chances of Passing
- Choose the Right Test Centre: Look at regional trends and pick a centre with a good pass rate.
- Book at the Right Time: Mid-morning or early afternoon slots are ideal.
- Be Consistent with Lessons: Avoid long gaps between sessions.
- Practice Independently: Supplement lessons with private practice sessions.
- Familiarise Yourself with the Test Route: While routes aren't published, local instructors often know common routes.
- Mock Tests: Take at least one mock test under exam conditions.
- Stay Calm on Test Day: Manage nerves with deep breathing exercises.
- Use Online Resources: Watch instructional YouTube channels like Conquer Driving or DGN Driving School.
📝 Debunking Common Driving Test Myths
-
“The Examiner Wants Me to Fail”
- Examiners follow strict guidelines and are impartial.
-
“The Test Centre You Choose Doesn’t Matter”
- Regional data proves otherwise—some centres have significantly higher pass rates.
-
“Stalling the Car is an Instant Fail”
- Stalling isn’t an automatic fail unless it causes a dangerous situation.
📌 Key Takeaway:
Separate fact from fiction to avoid unnecessary stress on test day.
✅ Final Checklist Before Your Driving Test
- [ ] Ensure your provisional licence is valid and with you.
- [ ] Bring a fully insured and roadworthy vehicle (if using your own).
- [ ] Practice 'Show Me, Tell Me' questions.
- [ ] Get a good night's sleep before your test.
- [ ] Arrive at the test centre at least 15 minutes early.
📝 Conclusion
Understanding UK driving test statistics provides valuable insights for learners, instructors, and policymakers alike. Whether it's choosing the right test centre, booking the optimal test time, or understanding demographic trends, being informed can give you a significant advantage.
By combining preparation, practice, and informed decision-making, you’ll not only pass your test efficiently but also become a confident and responsible driver.
Ready to start your driving journey? Find your ideal driving instructor today!